Ethnicity Estimate Comparisons
When I saw the recent announcement that Family Tree DNA was now accepting Ancestry V2 DNA uploads for autosomal transfer, I was excited, to say the least. I’ve been waiting impatiently for this since I did the testing last summer. So, I immediately uploaded my raw DNA. Here are my initial thoughts after trying it out.
Looking through my matches, I was surprised how many I recognized from my match lists from Ancestry. I’ve already identified the common ancestor for some of them. However, there are plenty that I still need to sort through to try to make that determination. As on Ancestry, many do not have pedigree information associated with their account. So, if I’m to determine how we match, I’ll need to make use of common matches.
I found the chromosome browser tool to be pretty cool. It’s one of the reasons I wanted to use Family Tree DNA. I’m a visual person, so a tool like this is really helpful to aid my understanding. Now I need to study up on segment matching so I actually know what I’m doing!
When I checked today, my ethnic origins had finished processing. I know the experts recommend taking ethnicity estimates with a grain of salt (or the whole darn salt shaker), but given how close the Ancestry estimates were to the estimate I made from my pedigree, I wasn’t expecting anything different on FTDNA. Boy, was I surprised!
According to Ancestry, my ethnic makeup looks something like this:
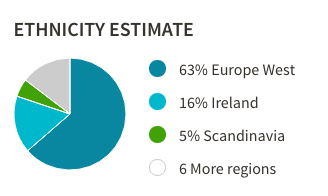
Figure 1: Ancestry’s Ethnicity estimate
According to Family Tree DNA, it looks more like this:
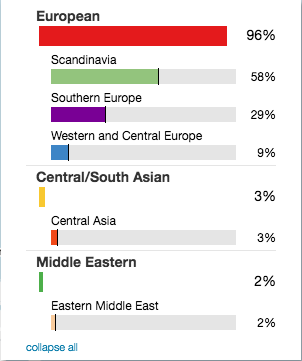
Figure 2: Family Tree DNA’s Ethnicity estimate
Surprise!
Here’s a comparison of the three estimates I’ve got in table form.
| Region | AncestryDNA | Pedigree | FTDNA |
|---|---|---|---|
| Western Europe | 63% | 73.72% | 9% |
| Ireland | 16% | 15.6% | — |
| Scandinavia | 5% | 3.12% | 58% |
| Great Britain | 4% | 1.56% | — |
| Italy/Greece | 2% | — | 29% |
| Iberian Peninsula | 4% | — | |
| European Jewish | <1% | — | — |
| Unknown | — | 6.24% | — |
| Central Asian | 4% | 3% | |
| Middle Eastern | — | — | 2% |
Here’s what the maps from the two companies look like:
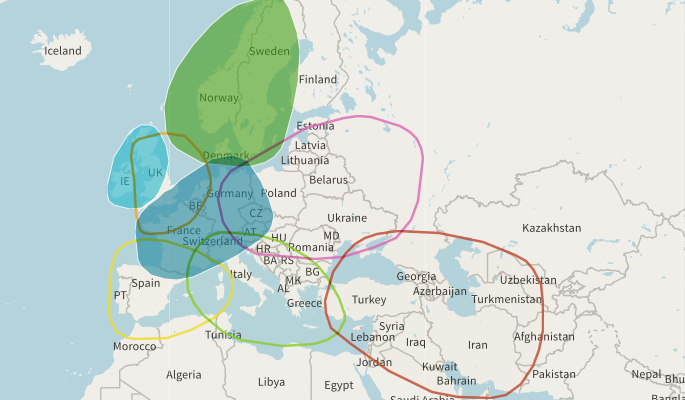
Figure 3: Ancestry’s Ethnicity Map (Outlines = trace DNA amounts)
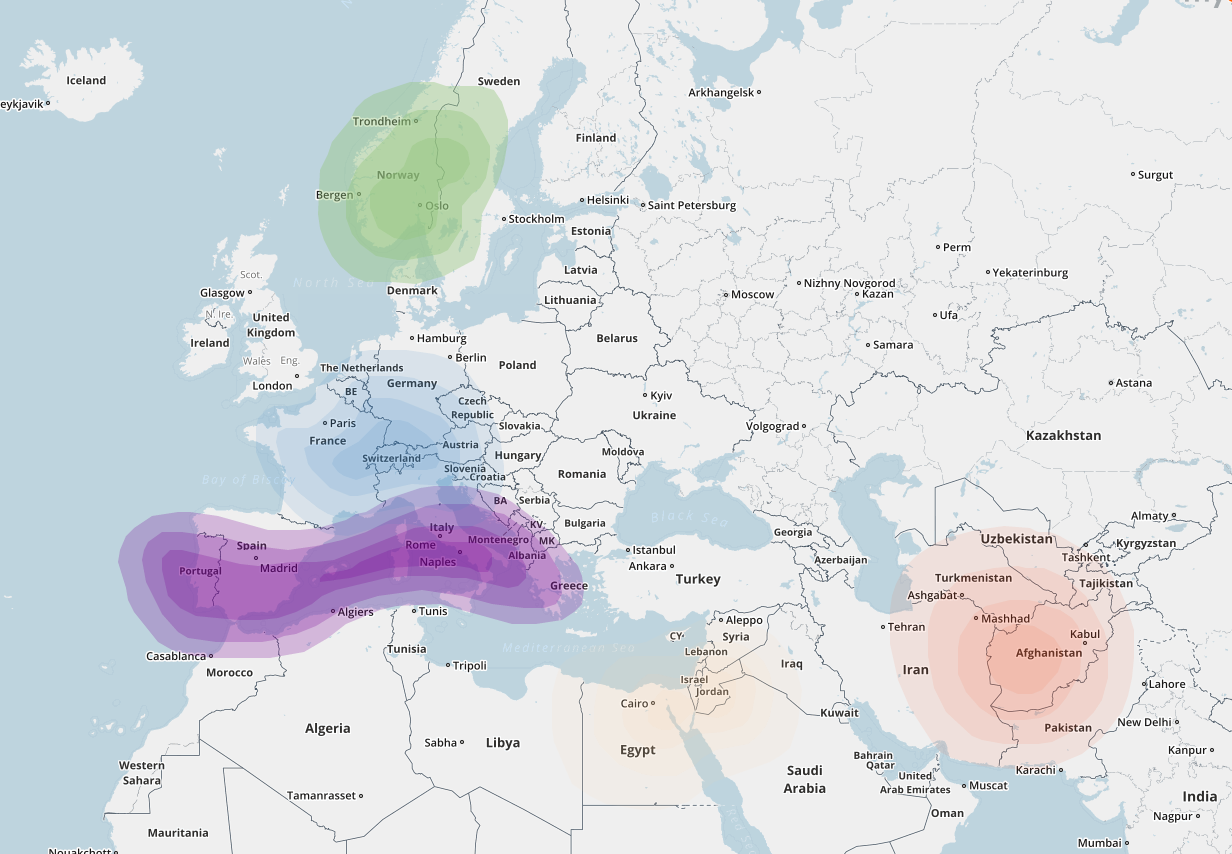
Figure 4: FTDNA’s Ethnicity Map
While the maps look similar in terms of the areas covered (except British Isles, Eastern Europe and Egypt), the ethnicity estimates do not. Why are they so different?
Part of the reason, I’m sure, has to do with the reference panel to which a DNA sample is compared. How the testing company geographically categorizes those references counts a bit, too. Ancestry separates Italy/Greece from the Iberian Peninsula, whereas FTDNA’s My Origins has one group: Southern Europe.
Genetic overlap is also a contributing factor. For instance, those from the British Isles are likely to demonstrate DNA from Scandinavia, Western Europe, and Southern Europe due to the various invasions/population influxes the islands experienced through the centuries. But I would think that at least some of this is accounted for in the process of mapping the various admixtures.
How does that help explain my results? I’m not entirely sure. I only have one ancestor who could be considered to be from Scandinavia (or Germany) going back at least six generations on either my paternal or maternal lines. My one Danish ancestor is five generations back and would account for only 3.12% of my DNA. So, how do I get 58% of my DNA from Scandinavia? That’s more than half my DNA! Roughly the equivalent amount of DNA contributed to me by one of my parents. I should be able to account for it more recently than five generations back.
The same can be said for Southern Europe. While I can see the possibility of DNA from Southern Europe being present in some of the Swiss/German or Irish ancestors, it’s many generations back. It would likely be diluted with other ethnicities. I can’t really see how it could account for 29% of my DNA—that’s a grandparent!
Nine percent of my DNA from Western/Central Europe seems exceedingly small. Especially when I can count 46 out of 64 ancestors six generations back as most likely being of German or Swiss descent. That’s approximately 72% of my DNA. The difference is almost laughable.
So, I’m a bit at a loss to explain these results.
Cite This Page:
Kris Hocker, "Ethnicity Estimate Comparisons," A Pennsylvania Dutch Genealogy, the genealogy & family research site of Kris Hocker, modified 12 Oct 2017 (https://www.krishocker.com/ethnicity-estimate-comparisons/ : accessed 22 Jul 2026).
Content copyright © 2017 Kris Hocker. Please do not copy without prior permission, attribution, and link back to this page.