My 23 and Me Results
I mentioned in my Genetic Genealogy update that I had uploaded my AncestryDNA file to 23 and Me. The results were not surprising and generally consistent with my ethnicity as predicted from my pedigree.
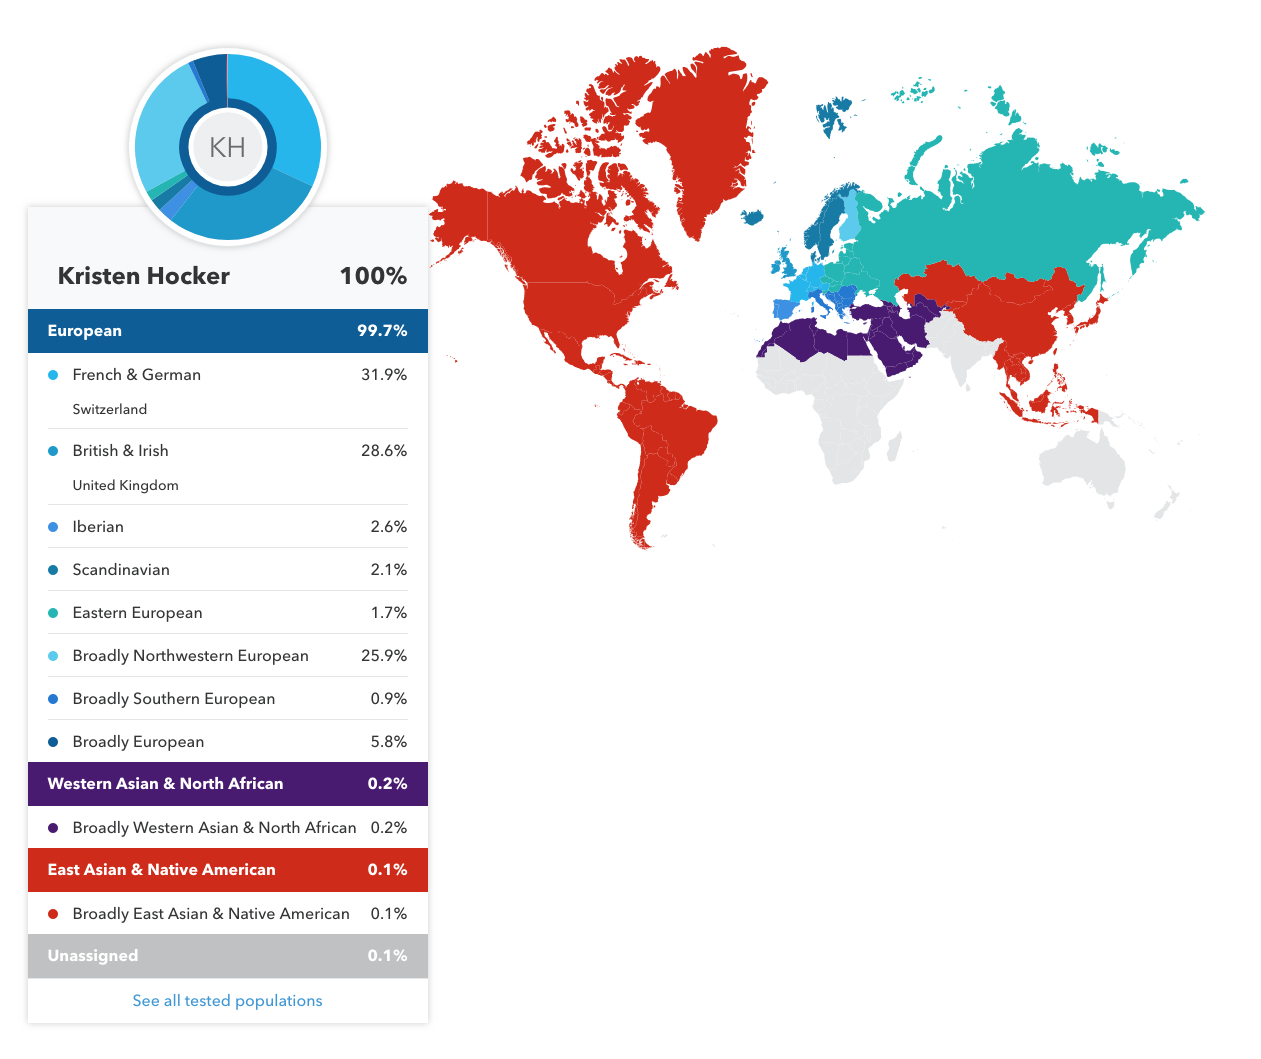
23 and Me Ethnicity Results
Surprisingly, even the percentages were fairly close—a little under on the Western European, a little over on the Great Britain/Ireland. Not all the categories matched exactly, so I used the closest corresponding categories. For instance, FTDNA showed “Sephardic Jew.” I included that in the “Iberian Peninsula” category since that is primarily where this population was historically located. West Middle East (i.e. Causcasus), I included in W. Asia/Africa.
| Region | 23 and Me | FTDNA | Ancestry | Pedigree |
|---|---|---|---|---|
| Western Europe | 63.6% | 89% | 63% | 73.72% |
| Ireland | see GB | see GB | 16% | 15.6% |
| Scandinavia | 2.1% | 6% | 5% | 3.12% |
| Great Britain | 28.6% | <2% | 4% | 1.56% |
| S.E. European | 0.9% | 2% | 2% | |
| Iberian Peninsula | 2.6% | <2% | 4% | |
| E. European/Jewish | 1.7% | <1% | ||
| E. Asia/America | 0.1% | |||
| S./Central Asia | <2% | <1% | ||
| W. Asia/Africa | 0.2% | <2% | 4% | |
| Unknown | 0.1% | 6.24% |
The differences can pretty much be explained by differences in the reference panels among the various testing companies and/or, I presume, a lack of knowledge of or specificity for the ancestral homes for some of my ancestors.
In my estimate I included all Germans in the Western Europe category, but as I understand it Eastern Germans are genetically more Slavic than Western Germans. My estimate would, therefore, vary from that of testing companies with Eastern European reference panels.
Those from Great Britain share common genetics with both Scandinavians and Western Europeans. Depending on where in Great Britain or Ireland my ancestors originated, their genetic heritage may show up as more one or the other.
23 and Me also places your ancestral composition onto a timeline, attempting to estimate the generation where you may have a single relative from a given ethnicity.
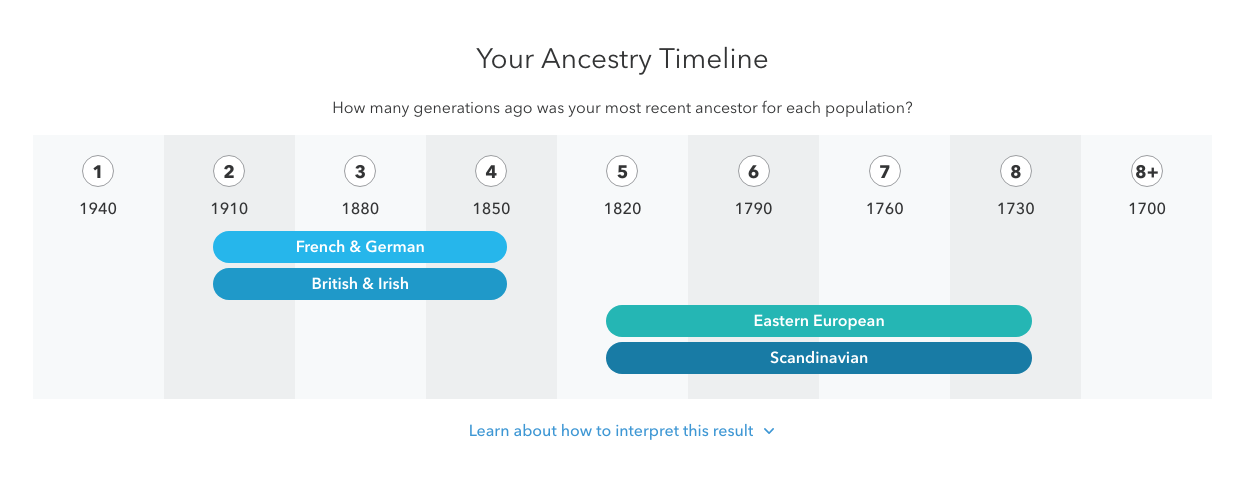
23 and Me Ancestral Timeline
Most of the comments I’ve read regarding this feature indicate that it’s not very accurate. Since it’s based on overall percentages, I can see how this would be true. I have a lot of German ancestors which could skew the results as being more recent.
However, I also have ancestors who fit the scenario of this timeline. For instance, my mother’s paternal great grandfather immigrated from Germany in 1855. His family was from Schönbrunn in central Germany. He might fit the “French & German” in this timeline.
Or say, my father’s paternal grandmother. She was born in Pennsylvania in 1893 to two recent immigrants from Scotland. Whether or not the DNA I inherited can actually be matched to these two individuals or not is still undetermined. But it’s an interesting scenario to consider.
I think the “Ancestry Composition Chromosome Painting” has the potential to be more useful. Given that I can use FTDNA, MyHeritage and GEDmatch to locate the exact chromosomal location where a cousin and I match, being able to identify the potential ethnicity of the most recent common ancestor may aid in determining just who that ancestor was. Maybe.
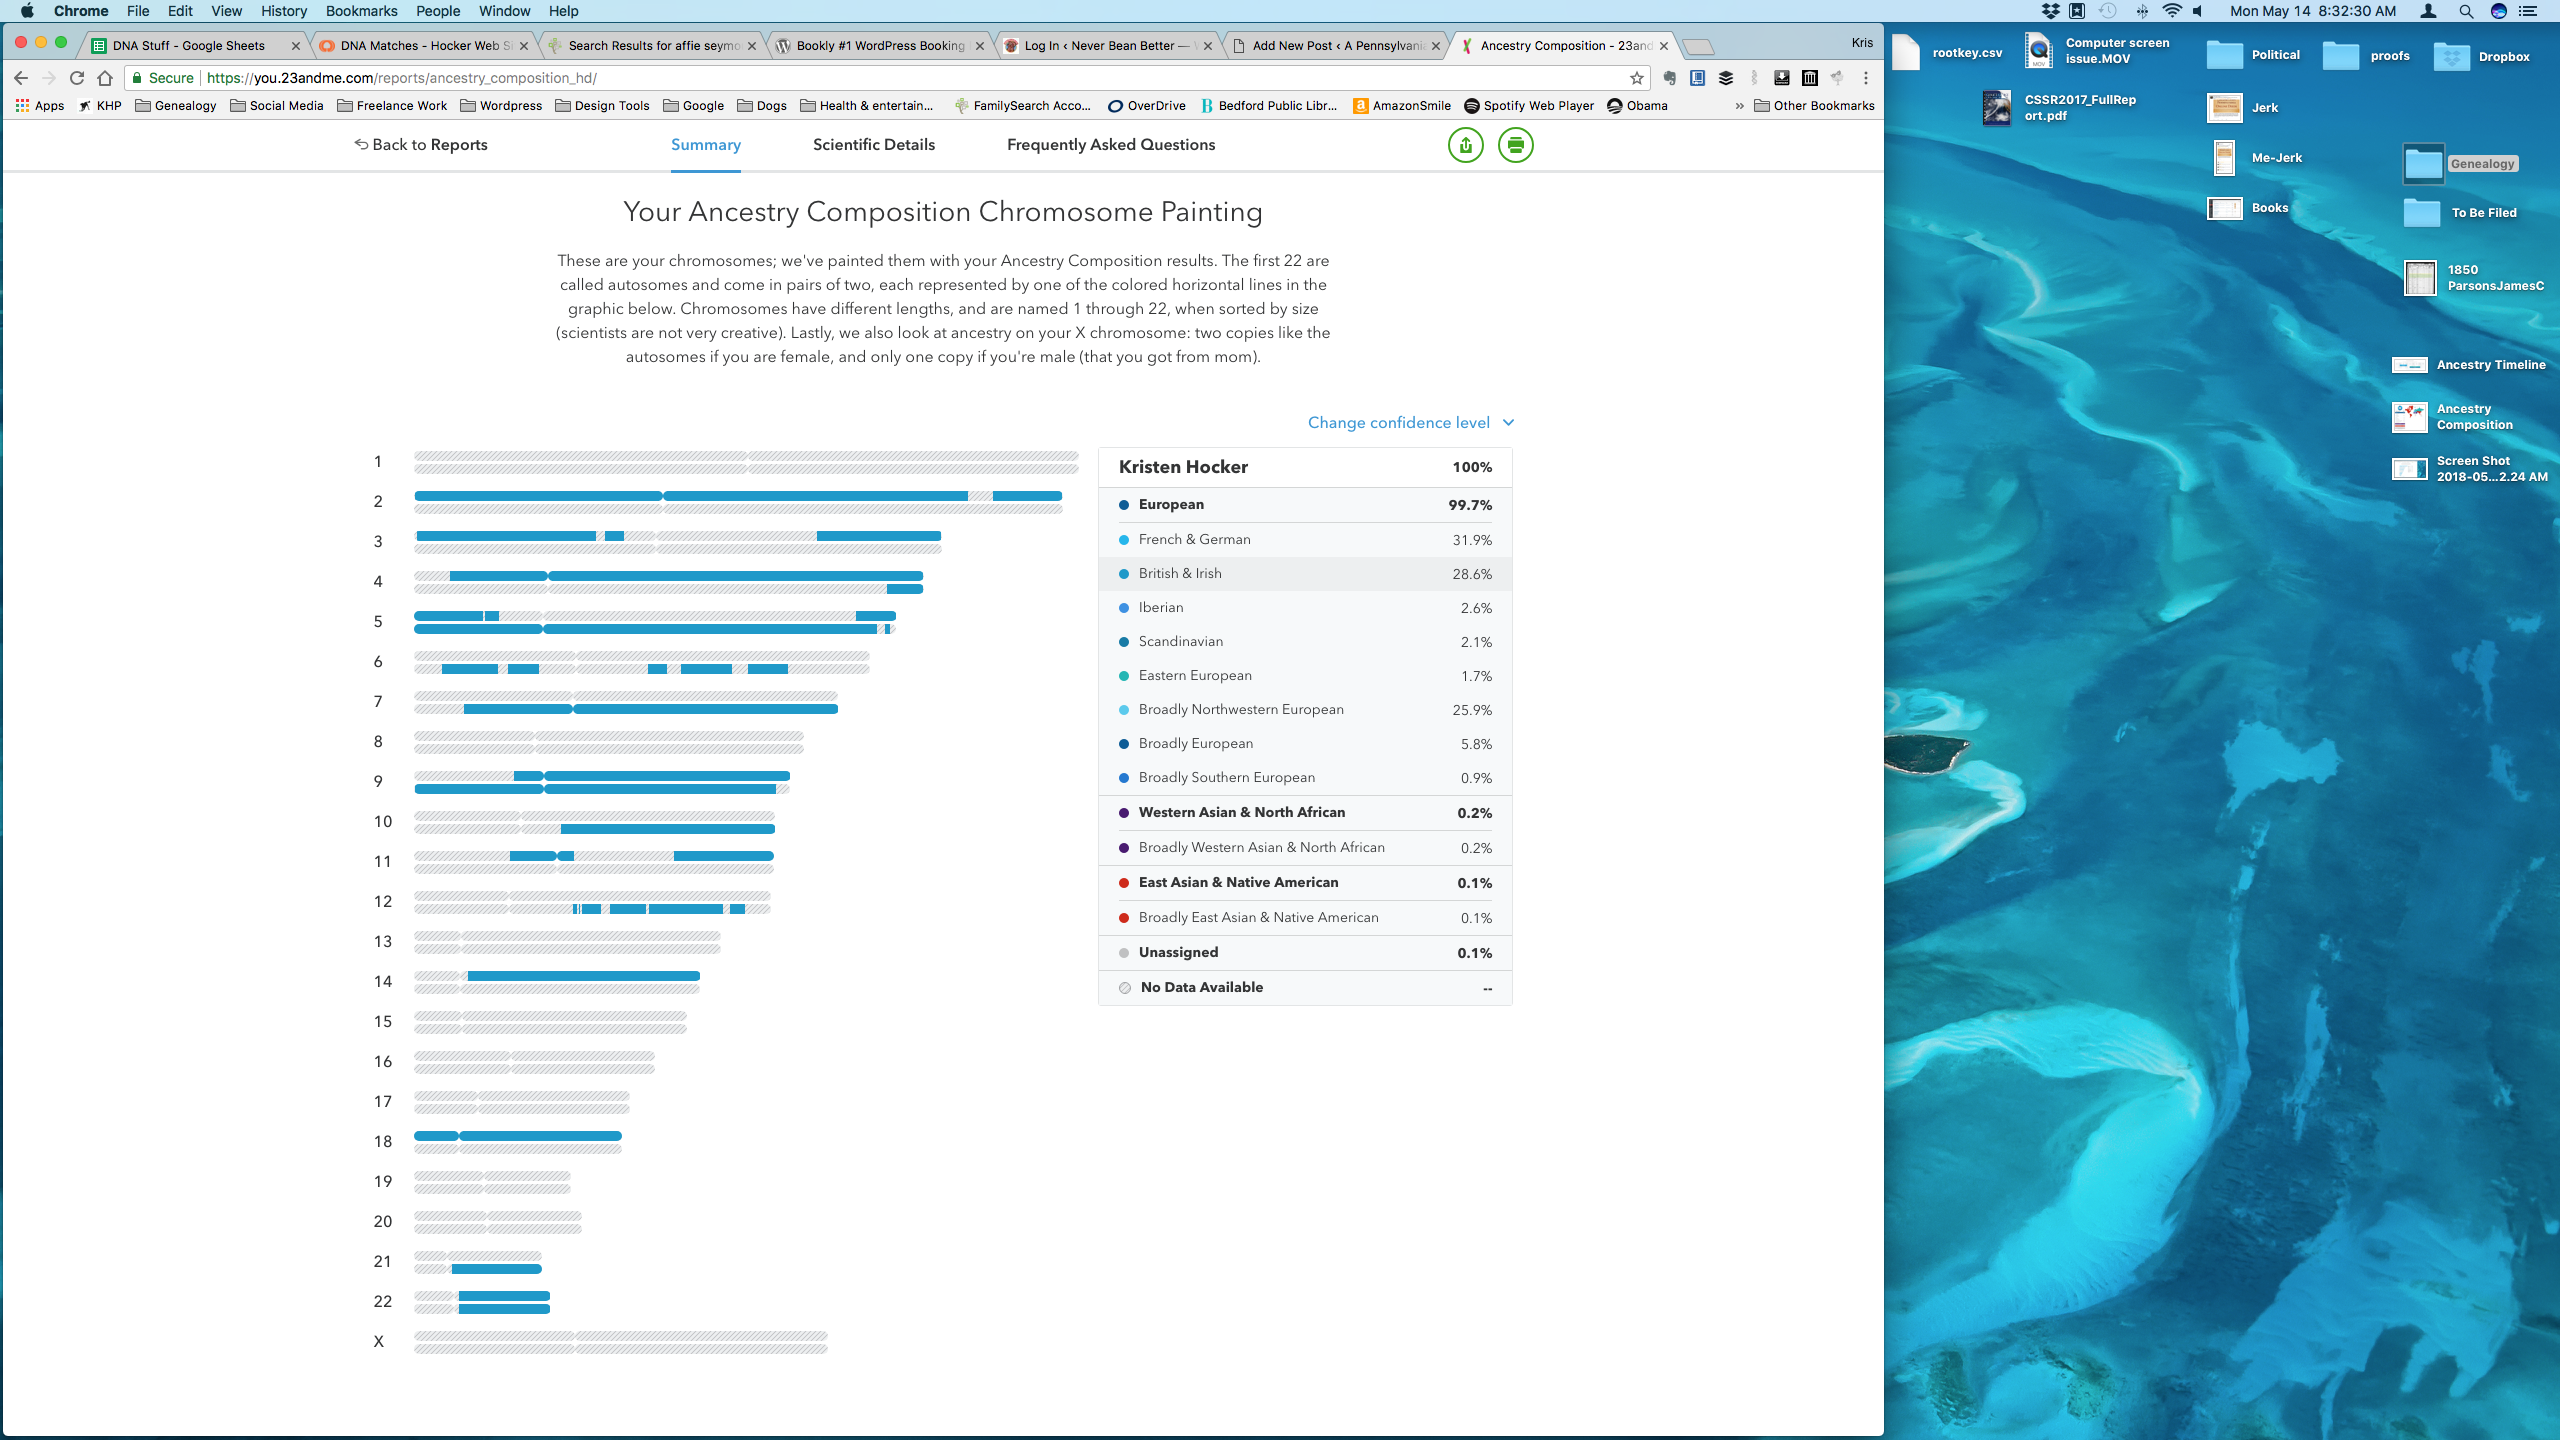
Ancestry Composition Chromosome Painting (British & Irish)
For instance, while I have no idea which parent is represented by which “chromosome” in this graphic, if I find a cousin who matches me on chromosome 22—since both sides appear to match the British & Irish reference panels, there’s a 50%1 likelihood that we match through a British or Irish ancestor.
Based on what I know about my pedigree that significantly decreases the possible ancestors from whom we could both descend. There just aren’t that many Brits/Irish/Welsh/Scots in my family tree. Still it would be an interesting theory to try to verify using the segments that I have identified.
Genetic genealogy is really fascinating. But, OMG, there’s so much to learn!
Footnotes
- The image reflects 23 and me’s confidence level at 50% (speculative) for assigning this ethnicity to those chromosomes. At 70% these estimates for that chromosome change a small amount. But at 90% confidence (conservative), the assigned ethnicity is “Broadly European.” ↩
Cite This Page:
Kris Hocker, "My 23 and Me Results," A Pennsylvania Dutch Genealogy, the genealogy & family research site of Kris Hocker, modified 14 May 2018 (https://www.krishocker.com/my-23-and-me-results/ : accessed 27 Apr 2024).
Content copyright © 2018 Kris Hocker. Please do not copy without prior permission, attribution, and link back to this page.
One Reply to “My 23 and Me Results”
Comments are closed.
I just finished reading “Futureface” by Alex Wagner. It’s a good genealogical-search-read, but her last chapters tore into all 3 DNA test providers. She was not very pleased with any of them, especially 23andMe. You might want to check out her book and see what she wrote.